SS-V: 5030 Reactions at the Ends of Axially Loaded Plastic
Bar
Test No. VNL04 Find reactions at the fixed ends and
maximum displacement of a bar axially loaded beyond plasticity.
Definition
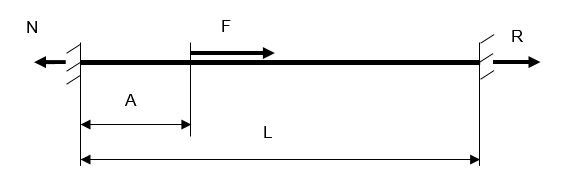
Figure 1.
Bar dimensions are 10 x 10 x 200 mm. Distance between loaded point and left end A=50
mm. Strain-stress curve of the bar material is defined by the power
law:
Where,
Strength coefficient
Must be in the range [0,1]
=0
Material is perfectly plastic.
=1
Material is elastic.
The material properties are:
Properties
Value
530 MPa
0.26
Poisson's Ratio
0
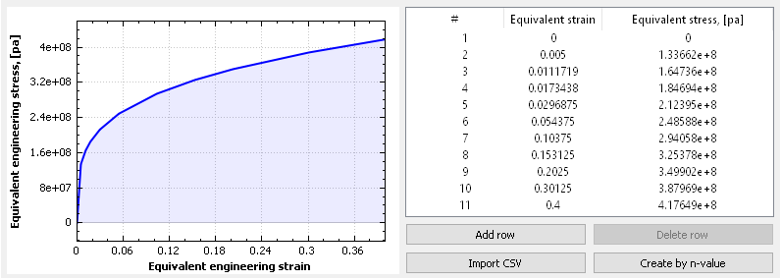
Figure 2. Corresponded strain-stress curve
The study was performed for the following load F values: 30000 N, 47000 N, 55000 N,
and 60000 N. These loads cover the full range of elastic-plastic response of the
bar.
Reference Solution
One-dimensional analytical reference solution is described here.
The length of the bar does not change under the load.
or,
Where,
Tensile strain at the left span of the bar.
Compressive strain at the right span of the bar,
Reaction force at left end of the bar.
Reaction force at the right end of the bar.
Bar cross-section area
From this equation you can find the reaction at the left end of the
bar.
and at the right end.
Results
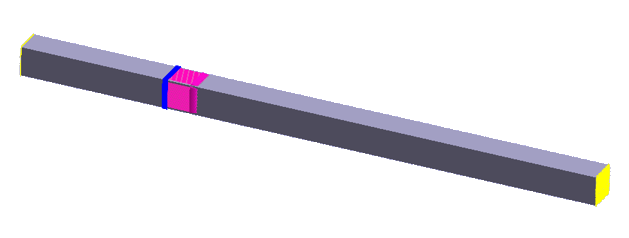
Bar was modeled as a 3D solid with immovable ends. Axial force F could not be applied
precisely at the solid bar axis, so four line spots were created at the bar sides
and total load F was uniformly distributed over the spots (Figure 3).Figure 3.
The following table summarizes the reaction force results.